×
Home 2024 Ranking Compare Countries Countries List Coalitions Builder Airpower Land Forces Naval Forces

2024 North Macedonia Military Strength


North Macedonia National flag graphic

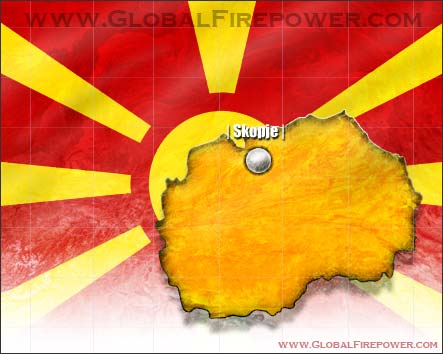
For 2024, North Macedonia is ranked 110 of 145 out of the countries considered for the annual GFP review. The nation holds a PwrIndx* score of 2.1717 (a score of 0.0000 is considered 'perfect'). This entry last reviewed on 01/09/2024.

*PwrIndx: Each nation is assessed on individual and collective values processed through an in-house formula to generate its 'PwrIndx' (Power Index) score. Some values are estimated when official numbers are not available. View the NOTES tab below for a detailed breakdown of other assessments.
North Macedonia country map image

Breakdown


NOTES:
The polar area chart above is intended to show relative inherent strengths and weakness at-a-glance; balance is prefered though not always achievable.
1) Manpower encompasses Active, Reserve, and any official Paramilitary forces identified for the nation; personnel from each branch of service is included.
2) Airpower includes war-making aerial systems, excluding trainers and drones.
3) Land Power includes motorized / mechanized vehicular elements as well as towed artillery and mechanized / towed MLRS systems.
4) Naval Power includes commissioned hulls ranging from Blue Water warships and submarines to Brown Water patrol assets (excluded for land-locked powers).
5) Financials average current financial health on the world stage.
6) Scores are an average of related categories in the GFP annual ranking.


North Macedonia is ranked 110 of 145 out of the countries considered for the annual Global Firepower review. The nation holds a Power Index score of 2.1717 with a score of 0.0000 being considered exceptional in the GFP assessment.
NATO logo graphic
This country is an Active Member of the NATO (North Atlantic Treaty Organization) alliance.
Landlocked country graphic image
Bordered by land on all sides without direct access to the sea, this country is landlocked.

Population
134/ 145
Avail.Manpwr
132/ 145
Fit-for-Serv
131/ 145
Mil.Age.Annu
132/ 145
Active Persn
111/ 145
Rez.Persn
47/ 145
Paramil.Persn
46/ 145
Aircraft
99/ 145
Fighters
145/ 145
Attack Types
145/ 145
Transports
145/ 145
Trainers
71/ 145
Spl.Mission
145/ 145
Tankers
145/ 145
Helicopters
86/ 145
Attack Helos
43/ 145
Tanks
90/ 145
Vehicles
96/ 145
Artillery (SP)
145/ 145
Art.(Towed)
43/ 145
MLRS
63/ 145
Oil Prod
145/ 145
Oil Consump
18/ 145
Oil Rez.Proven
145/ 145
Nat.Gas Prod
145/ 145
NatGas Cons
12/ 145
NatGas Rez
145/ 145
Coal Prod
35/ 145
Coal Consump
71/ 145
Coal Rez.Prvn
48/ 145
Labor Force
134/ 145
Merch.Marines
145/ 145
Major Ports
145/ 145
Roadways
124/ 145
Railways
98/ 145
Airports
105/ 145
Def.Budget
119/ 145
Ext.Debt
32/ 145
Foreign Rez
103/ 145
Purch.Power
125/ 145
Sq.Land Area
133/ 145
Shared Border
17/ 145
Waterways
145/ 145


Excellent
Good
Average
Fair
Poor


GENERAL CAPABILITIES
Theoretical, automatically generated based on supplied values.

National Defense
Guerilla/Asymmetric Warfare
Internal Security
Land Convoy Protection
Indirect Fire Support


The act of waging (and sustaining) a prolonged conflict requires a massive financial commitment from all parties involved. As such, GFP focuses on a select group of financially-related categories showcased below.


Small graph icon
125/145
Purchasing Power Parity:
$34,007,000,000 USD
Small graph icon
103/145
Foreign Exchange/Gold:
$4,129,000,000 USD
Small graph icon
119/145
Defense Budget:
$295,015,800 USD
Small graph icon
32/145
External Debt:
$10,000,000,000 USD
All monetary values presented in United States Dollar (USD$).


Manpower is one of the few categories that every nation satisfies in the GFP index to one extent or another. These categories detail the maximum and realistic number of souls a given nation can commit to a war effort, be it offensive or defensive in nature.


Small graph icon
134/145
Total Population:
2,133,410
Small graph icon
132/145
Available Manpower
947,234 (44.4%)
Small graph icon
131/145
Fit-for-Service
782,961 (36.7%)
Small graph icon
132/145
Reaching Mil Age Annually
27,734 (1.3%)
Tot Mil. Personnel (est.)
72,500 (3.4%)
Small graph icon
111/145
Active Personnel
9,000 (0.4%)
Small graph icon
47/145
Reserve Personnel
60,000 (2.8%)
Small graph icon
46/145
Paramilitary
3,500 (0.2%)
Small graph icon
84/145
Air Force Personnel*
350
Small graph icon
90/145
Army Personnel*
7,500
Small graph icon
145/145
Navy Personnel*
0


*These values may be estimated.
Manpower Composition:
Hover over the various color-coded sections in the bar below for details on each category.


GFP tracks specific categories related to aerial warfare capabilities of a given power. READINESS values are based against the U.S. Air Force's 75% average across all categories to account for availability of individual over-battlefield assets due to general maintenance, modernization, refurbishment and the like. Percent values are % of total inventory stock available.


Small graph icon
99/145
Aircraft Total:
Stock: 20
Readiness: 11*
Small graph icon
145/145
Fighters:
Stock: 0 (0.0%)
Readiness: 0*
Small graph icon
145/145
Attack Types:
Stock: 0 (0.0%)
Readiness: 0*
Small graph icon
145/145
Transports (Fixed-Wing):
Stock: 0 (0.0%)
Readiness: 0*
Small graph icon
71/145
Trainers:
Stock: 10 (50.0%)
Readiness: 6*
Small graph icon
145/145
Special-Mission:
Stock: 0 (0.0%)
Readiness: 0*
Small graph icon
145/145
Tanker Fleet:
Stock: 0 (0.0%)
Readiness: 0*
Small graph icon
86/145
Helicopters:
Stock: 10 (50.0%)
Readiness: 6*
Small graph icon
43/145
Attack Helicopters:
Stock: 4 (20.0%)
Readiness: 2*


*Values are estimated.
Inventory Composition:
Hover over pie slices in the chart below for category information. Pecentages below are not part of overall strength above but rather relative to each category presented below.

For an in-depth overview of current leading air powers of the world, including active inventories and strengths, consult the World Directory of Modern Military Aircraft (www.WDMMA.org).

GFP tracks specific categories related to land warfare capabilities of a given power. READINESS values are based against the U.S. Army's 80% average across all categories to account for availability of individual battlefield assets due to general maintenance, modernization, refurbishment and the like.


Small graph icon
90/145
Tanks:
Stock: 23
Readiness: 13*
Small graph icon
96/145
Vehicles:
Stock: 2,156
Readiness: 1,186*
Small graph icon
145/145
Self-Propelled Artillery:
Stock: 0
Readiness: 0*
Small graph icon
43/145
Towed Artillery:
Stock: 191
Readiness: 105*
Small graph icon
63/145
MLRS (Rocket Artillery):
Stock: 24
Readiness: 13*


*Values are estimated.
Inventory Composition:
Hover over pie slices in the chart below for category information.


End-use products reflect a given nation's ability to produce products through manufacturing, industry, and / or agriculture.
Icon image of a pile of barley
BARLEY
Icon image of two wine glasses
BEVRGES
Icon image of cabbage head
CABBAGE
Icon image of cement bag
CEMENT
Icon image of chemicals
CHEMICLS
Icon image of corn cob
CORN
Icon image of food processing equipment
FOODPROC
Icon image of a grape clump
GRAPES
Icon image of an iron nugget
IRON
Icon image of various melon types
MELONS
Icon image of a milk carton
MILK
Icon image of pharmaceuticals
PHARMA
Icon image of a potato
POTATOES
Icon image of steel beams
STEEL
Icon image of textile swatches
TEXTILES
Icon image of a tomato clump on-the-vine
TOMATOES
Icon image of a watermelon
WATRMLN
Icon image of wheat
WHEAT


The GFP index tracks crude Oil (petroleum) and (new as of 2023) Natural Gas and Coal usage / reserves / stock for each country. Natural resources are critical to a nation in both war and peace time, in some cases forming the lifeblood of a given world power. 2022 showed just how natural resources can be 'weaponized' by one party over another.


Small graph icon
145/145
Oil Production:
0 bbl
Small graph icon
18/145
Oil Consumption:
23,000 bbl
Oil Deficit:
-23,000 bbl
Small graph icon
145/145
Oil Proven Reserves:
0 bbl

Small graph icon
145/145
Natural Gas Production:
0 cu.m
Small graph icon
12/145
Natural Gas Consumption:
218,917,000 cu.m
Natural Gas Deficit:
-218,917,000 cu.m
Small graph icon
145/145
Nat.Gas Proven Rez:
0 cu.m

Small graph icon
35/145
Coal Production:
5,026,000 mt
Small graph icon
71/145
Coal Consumption:
5,211,000 mt
Coal Deficit:
-185,000 mt
Small graph icon
48/145
Coal Proven Reserves:
332,000,000 mt
Oil bbl represented as unit 'barrel of oil'. Natural Gas represented in 'cubic meters'. Coal represented in 'metric tons'.


The GFP formula tracks various factors related to logistics which prove critical to any one global power in both war and peace time. These factor into a nation's ability to move man, machine, and supplies from one point to another - a particularly important quality when considering mass-mobilization.


Small graph icon
134/145
Labor Force:
916,200
Small graph icon
145/145
Merchant Marine Fleet:
0
Small graph icon
145/145
Ports / Trade Terminals:
0
Small graph icon
105/145
Airports:
10
Small graph icon
124/145
Roadway Coverage:
14,182 km
Small graph icon
98/145
Railway Coverage:
699 km
Small graph icon
145/145
Waterways (usable):
0 km


FINANCIALS - Values partly derived from the CIA World Factbook and presented in USD ($). Estimates made when needed.

GEOGRAPHY - Values derived from the CIA World Factbook. As geography can play a role in both offensive and defensive wars, the GFP formula takes geographic qualities into account (border coverage, coastline coverage).

CAPITAL - Basic details covering the name, population, temperature, and precipitation values of a given capital city.

MANPOWER - Values partly derived from the CIA World Factbook. Some values may be estimated.

AIRPOWER - Values derived from multiple sources. Estimates made when required. Total Aircraft Strength value includes both fixed-wing and rotorcraft platforms from all branches of service (at this time UAVs are not included). 'Attack' value constitutes purpose-built, fixed-wing dedicated attack types. 'Transports' value includes only fixed-wing aircraft while all rotorcraft are represented under the 'Helicopters' value. For an in-depth look into the current air powers of the world, consider "the World Directory of Modern Military Aircraft" [www.WDMMA.org - external link].

LAND FORCES - Values derived from multiple sources. Estimates made when required. 'Tanks' value includes Main Battle Tanks (MBTs), medium tanks, and light tanks. 'Vehicles' value includes APCs, IFVs, MRAPs, Armored Cars, and support / logistical / engineering types. 'Rocket Projectors' (MLRSs) include self-propelled and towed forms.

NAVAL FORCES - Values derived from multiple sources. Estimates made when required. 'Total Assets' value includes all possible / available vessels including auxiliaries. 'Aircraft Carriers' value includes only traditional through-deck carriers (both conventionally- and nuclear-powered); Helicopter Carriers are considered in their own separate listing. 'Submarines' value includes both diesel-electric and nuclear-powered types. Landlocked nations are not penalized for the lack of a standing navy. For an in-depth look into the current naval powers of the world, consider "the World Directory of Modern Military Warships" [www.WDMMW.org - external link].

END-USE PRODUCTS - Graphics intended to showcase manufacturing, industrial, and agricultural prowess of a global power. Not all products may be accounted for in the showcase.

NATURAL RESOURCES - Values derived from the CIA World Factbook or estimated in some cases. Values presented as BBL (Barrel unit), cu.m (Cubic Meters), and mt (Metric Tons).

LOGISTICS - Values derived from the CIA World Factbook. Ports & Terminals may reside outside of a nations own borders if arrangements with an ally have been made. Landlocked nations are penalized for the lack of a standing Merchant Marine force.

Comparable Powers


Entries below showcase broadly similar fighting capabilities

Cambodia
Image of the geographic map of Cambodia
Kyrgyzstan
Image of the geographic map of Kyrgyzstan
Ghana
Image of the geographic map of Ghana
Coalitions Builder
Two Coalitions, Up to 7 Nations Each

Neighboring Powers


Based on geographic proximity to host nation

Albania
Image of the geographic map of Albania
Bulgaria
Image of the geographic map of Bulgaria
Greece
Image of the geographic map of Greece

Top Visiting Countries (April, 2024)

Flag of United States
68.3%
Flag of United Kingdom
11.1%
Flag of Canada
6.9%
Flag of Australia
4.4%
Flag of India
4.0%
Flag of Germany
2.8%
Flag of Italy
2.4%
Disclaimer | Privacy Policy | Cookies


World War Next

National flag of Afghanistan National flag of Albania National flag of Algeria National flag of Angola National flag of Argentina National flag of Armenia National flag of Australia National flag of Austria National flag of Azerbaijan National flag of Bahrain National flag of Bangladesh National flag of Belarus National flag of Belgium National flag of Beliz National flag of Benin National flag of Bosnia and Herzegovina National flag of Brazil National flag of Bulgaria National flag of Cambodia National flag of Canada National flag of Chile National flag of China National flag of Colombia National flag of Croatia National flag of Czechia National flag of Denmark National flag of Ecuador National flag of Egypt National flag of Eritrea National flag of Estonia National flag of Ethiopia National flag of Finland National flag of France National flag of Germany National flag of Greece National flag of Hungary National flag of Iceland National flag of India National flag of Indonesia National flag of Iran National flag of Iraq National flag of Israel National flag of Italy National flag of Japan National flag of Jordan National flag of Kazakhstan National flag of Kenya National flag of Kuwait National flag of Luxembourg National flag of Malaysia National flag of Mexico National flag of Myanmar National flag of the Netherlands National flag of New Zealand National flag of Nigeria National flag of North Korea National flag of Norway National flag of Oman National flag of Pakistan National flag of Peru National flag of the Philippines National flag of Poland National flag of Portugal National flag of Qatar National flag of Romania National flag of Russia National flag of Saudi Arabia National flag of Senegal National flag of Serbia National flag of Singapore National flag of Slovakia National flag of Slovenia National flag of Somalia National flag of South Africa National flag of South Korea National flag of South Sudan National flag of Spain National flag of Sweden National flag of Switzerland National flag of Syria National flag of Taiwan National flag of Thailand National flag of Tunisia National flag of Turkey National flag of Turkmenistan National flag of Ukraine National flag of the United Arab Emirates National flag of the United Kingdom (Britain) National flag of the United States National flag of Uzbekistan National flag of Venezuela National flag of Vietnam National flag of Yemen


The GlobalFirepower.com logo is a trademark of this website and is protected by all applicable domestic and international intellectual property laws. The published content of the pages contained herein is unique to this website (unless where indicated) and not for reuse in any form. About: GlobalFirepower.com is an annually-updated, statistics-based website tracking defense-related information of 145 nations and exists as a wholly-independent resource. Part of the Military Factory network of sites that includes MilitaryFactory.com, WDMMA.org, and WDMMW.org. No A.I. was used in the generation of this content.
WARPOWER SERIES:
Warpower:Australia | Warpower:Bangladesh | Warpower:China | Warpower:Egypt | Warpower:Greece | Warpower:India | Warpower:Indonesia | Warpower:Iran | Warpower:Israel | Warpower:NorthKorea | Warpower:Philippines | Warpower:Poland | Warpower:Russia | Warpower:Saudi Arabia | Warpower:Taiwan | Warpower:Turkiye | Warpower:UK | Warpower:Ukraine | Warpower:US


©2024 www.GlobalFirepower.com • All Rights Reserved • Content ©2006-2024 (18yrs)